Monday, February 14, 2011

St. Croix Valley Economic Dashboard for February Released

The UW- River Falls Center for Economic Research (CER) in partnership with St. Croix Economic Development Corporation (SCEDC) has released the February edition of the St. Croix Valley Economic Dashboard. The dashboard presents a snapshot of the economic condition of the labor, consumer and housing markets in the three county area. It presents the latest available data in one convenient package and can be viewed on the CER’s website at www.uwrf.edu/cer.


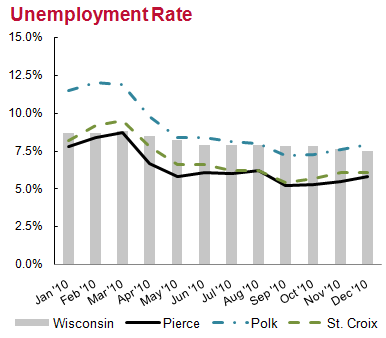
The latest labor market data indicates continued slow recovery. The unemployment rate fell in December as compared to December 2009 in all three counties, while both labor force and total employment increased relative to the previous year. The most encouraging statistic is the labor force. As the Labor market continues to recover, we should expect to see discouraged workers, workers who have given-up on trying to find a job, resume their job search.
urathis_feb11

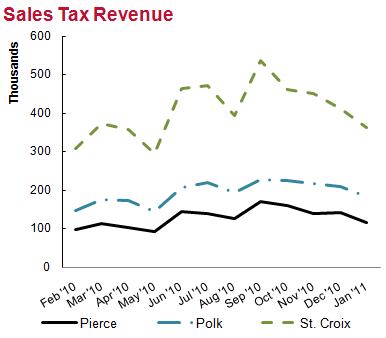
The consumer market is showing signs of growth as well. County sales tax revenue collected in January 2011 increased as compared to one year ago for all three counties. Moreover, new vehicle registration for January 2011 is up from last year. Both indicators are signaling an increasing willingness on the part of the consumer to spend.

salestax_feb11
The housing market, however, is still struggling. Median home price fell in January for three counties as compared to January 2010, but the number of homes sold increased year over year in Polk and St. Croix counties. The local housing market statistic appear to be consistent with the national housing market situation, and is still coping with a large inventory and lower availability of mortgage lending.

homeprice_feb11

St. Croix, Polk, and Pierce counties comprise Wisconsin’s St. Croix Valley. All three counties are located along the Wisconsin-Minnesota border. Two of the three counties, St. Croix and Pierce, are included in the Minneapolis-St. Paul-Bloomington MN-WI metropolitan area, a 13-county region with of population of 3.25 million residents. For additional information on the February edition of the St. Croix Valley Economic Dashboard, contact Dr. Logan Kelly at cer@uwrf.edu or (715) 425-4993 or William Rubin at bill@stcroixedc.com or (715) 381-4383.
Saturday, February 5, 2011

Making sense of the employment numbers

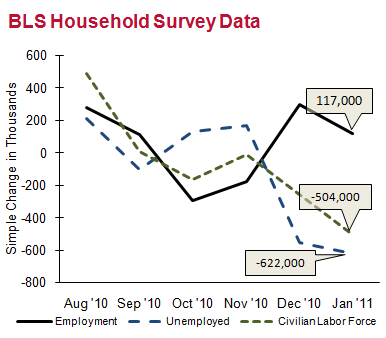
On Friday, February 4, the Bureau of Labor Statistics Released the January jobs report. The news on the whole was less than encouraging. The unemployment rate fell by 0.4 percentage points to 9.0 percent, which is good news, but nonfarm payroll employment increased by only 36,000 jobs according to the BLS survey of employers (Note that the household survey reports an increase of 117,000 jobs, but more on that latter). An increase of only 36,000 jobs is disappointing to say the least and suggests that the unemployment rate is falling for all the wrong reasons. People are dropping out of the labor market.
 BLS Household Survey Data
 In the figure above, the simple change in the civilian labor force (the number of able-bodied adults not in the military), employment (the number of people in the civilian labor force with a job), and unemployment (the number of people in the civilian labor force without a job) are plotted. We are encouraged to see that there were 622,000 fewer unemployed persons in January, but that encouragement is short lived when we realize that only 117,000 of those people found jobs. The rest left the labor force, in other words, stopped looking for a job. Thus, this is one of those times when a lower unemployment rate is not a good sign. In fact many economists, myself included, expect the unemployment rate to increase as the labor market begins to recover in earnest because formerly discouraged workers will reenter the job market.

So how may jobs were added to the economy last month? 36,000 or 117,000? That depends on who you ask. The two numbers come from two surveys conducted by the Bureau of Labor Statistics: a survey of households and a survey of businesses. The survey of businesses may not be counting all of the new jobs in the economy because very new businesses are not included in the survey. Why? Because the Bureau of Labor Statistics do not know they exist yet or how to contact them. Whichever number we accept, the conclusion is the same: the economy is not creating jobs fast enough to make a significant dent in unemployment. This is not unexpected, though.

Recessions like the last recession are rare and particularly nasty. The last recession was caused by a financial market collapse not unlike what sparked the Great Depression. A careful examination of recessions of this type throughout history reveals that one common feature is a particularly long and slow recovery period. The unfortunate truth is that there may be no macroeconomic policy we can take that will be effective in lowering the unemployment rate in the near future.